Category:NOAA regional climate maps
Jump to navigation
Jump to search
Media in category "NOAA regional climate maps"
The following 200 files are in this category, out of 205 total.
(previous page) (next page)-
1cavg1 202308 Europe average temperatures.png 2,700 × 2,700; 840 KB
-
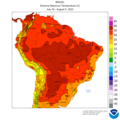
1cavg15 202308 Northern South America average temperatures.png 3,000 × 3,000; 901 KB
-
1cavg2 2022-08 East Asia.png 2,000 × 1,700; 518 KB
-
1cpcp1 202205 europe.png 1,800 × 1,800; 659 KB
-
1cpcp1 202206 Europe.png 1,800 × 1,800; 646 KB
-
1cpcp1 202303 Europe.png 2,700 × 2,700; 993 KB
-
1cpcp1 202304 Europe.png 2,700 × 2,700; 984 KB
-
1cpcp1 202305 Europe.png 2,700 × 2,700; 1.03 MB
-
1cpcp1 June 2019.png 2,700 × 2,700; 290 KB
-
1cpnp1 2022-08 Europe.png 2,700 × 2,700; 1.29 MB
-
1cpnp1 202206 Europe.png 1,800 × 1,800; 780 KB
-
1cpnp1 202303 Europe.png 2,700 × 2,700; 1.18 MB
-
1cpnp1 202304 Europe.png 2,700 × 2,700; 1.21 MB
-
1cpnp1 202305 Europe.png 2,700 × 2,700; 1.17 MB
-
1cpnp1 202308 Europe precipitation.png 2,700 × 2,700; 1.23 MB
-
1cpnp1.png 1,800 × 1,800; 757 KB
-
1ctan0 202303 USA.png 6,600 × 5,100; 2.24 MB
-
1ctan1 202302 Europe.png 2,700 × 2,700; 822 KB
-
1ctan1 202304 Europe.png 2,700 × 2,700; 851 KB
-
1ctan1 202305 Europe.png 2,700 × 2,700; 889 KB
-
1ctan1 202306 Europe temperature anomalies.png 2,700 × 2,700; 892 KB
-
1ctan1 202308 Europe temperature anomalies.png 2,700 × 2,700; 853 KB
-
1ctan1 202309 Europe temperature anomalies.png 2,700 × 2,700; 857 KB
-
1ctan1 March2023 Europe.png 2,700 × 2,700; 837 KB
-
1ctan11 202303 South Africa.png 2,550 × 2,700; 527 KB
-
1ctan12 202303 Northwestern Africa.png 2,000 × 1,000; 172 KB
-
1ctan13 202303 Middle East.png 3,000 × 1,800; 516 KB
-
1ctan15 202303 Norther South America.png 3,000 × 3,000; 865 KB
-
1ctan15 202305 Northern South America temperature anomalies.png 3,000 × 3,000; 841 KB
-
1ctan15 202308 Northern South America temperature anomalies.png 3,000 × 3,000; 796 KB
-
1ctan2 202303 Eastern Asia.png 2,000 × 1,700; 483 KB
-
1ctan2 202304 East Asia.png 2,000 × 1,700; 480 KB
-
1ctan2 202305 East Asia temperature anomaly.png 3,000 × 2,550; 788 KB
-
1ctan2 202306 East Asia temperature anomalies.png 2,000 × 1,700; 492 KB
-
1ctan2 202308 East Asia.png 2,000 × 1,700; 490 KB
-
1ctan3 202303 Western FSU.png 3,000 × 2,550; 588 KB
-
1ctan5 202303 Southeast Asia.png 1,800 × 1,800; 359 KB
-
1ctan5 202304 Southeast Asia.png 1,800 × 1,800; 358 KB
-
1ctan5 202305 Southeast Asia temperature anomalies.png 1,800 × 1,800; 354 KB
-
1ctan5 202306 Southeast Asia temperature anomalies.png 1,800 × 1,800; 350 KB
-
1ctan5 202308 Southeast Asia temperature anomalies.png 1,800 × 1,800; 364 KB
-
1ctan6 202302 SouthAsia.png 1,600 × 1,800; 370 KB
-
1ctan6 202303 South Asia.png 1,600 × 1,800; 377 KB
-
1ctan6 202304 South Asia.png 1,600 × 1,800; 377 KB
-
1ctan6 202305 South Asia temperature anomalies.png 1,600 × 1,800; 380 KB
-
1ctan6 202306 South Asia temperature anomalies.png 1,600 × 1,800; 375 KB
-
1ctan6 202308 South Asia temperature anomalies.png 2,400 × 2,700; 604 KB
-
1ctan7 202302 Australia.png 3,000 × 2,400; 534 KB
-
1ctan7 202303 Australia.png 3,000 × 2,400; 518 KB
-
1ctan7 202304 Australia.png 3,000 × 2,400; 533 KB
-
1ctan7 202305 Australia temperature anomalies.png 3,000 × 2,400; 522 KB
-
1ctan7 202306 Australia temperature anomalies.png 3,000 × 2,400; 528 KB
-
1ctan7 202308 Australia temperature anomalies.png 3,000 × 2,400; 540 KB
-
1ctan8 202303 Southern South America.png 2,550 × 3,000; 618 KB
-
1ctan8 202306 Southern South America temperature anomalies.png 2,550 × 3,000; 584 KB
-
1ctan8 202308 Southern South America temperature anomalies.png 2,550 × 3,000; 585 KB
-
1ctan9 202303 Mexico.png 2,550 × 2,040; 522 KB
-
1ctan9 202306 Mexico temperature anomalies.png 2,550 × 2,040; 542 KB
-
1ctan9 202308 Mexico temperature anomalies.png 2,550 × 2,040; 528 KB
-
2019-20 Dec-Feb CPC Europe percent of normal precipitation.png 2,700 × 2,700; 420 KB
-
2019-20 Dec-Feb CPC Europe total precipitation.png 2,700 × 2,700; 323 KB
-
2020 August CPC Europe total precipitation.png 2,700 × 2,700; 354 KB
-
2020 July CPC Europe total precipitation.png 2,700 × 2,700; 361 KB
-
2020 March–May CPC Europe total precipitation.png 2,700 × 2,700; 311 KB
-
2020 May CPC Europe total precipitation.png 2,700 × 2,700; 349 KB
-
2020-03 CPC Europe total precipitation.png 2,700 × 2,700; 351 KB
-
2020-04 CPC Europe percent of normal precipitation.png 2,700 × 2,700; 405 KB
-
2020-04 CPC Europe total precipitation.png 2,700 × 2,700; 359 KB
-
20220816 United States drought conditions.png 3,300 × 2,550; 392 KB
-
20230110 United States drought conditions.png 3,300 × 2,550; 376 KB
-
20230117 United States drought conditions.png 3,300 × 2,550; 376 KB
-
3cpcp1 202203 202205 Europe.png 1,800 × 1,800; 562 KB
-
3cpcp1 202212-202302 Europe.png 1,800 × 1,800; 548 KB
-
3cpnp1 202203 202205 Europe.png 1,800 × 1,800; 738 KB
-
3cpnp1 202212 202302 Europe.png 1,800 × 1,800; 762 KB
-
3ctan1 temperature anomalies Europe 202212 202302 2ndwarmest Winter in Europe.png 1,800 × 1,800; 530 KB
-
3ctan2 202306-202308 East Asia temperature anomalies.png 2,000 × 1,700; 483 KB
-
3ctan5 202306-202308 Southeast Asia temperature anomalies.png 1,800 × 1,800; 353 KB
-
3ctan6 202306-202308 South Asia temperature anomalies.png 1,600 × 1,800; 376 KB
-
3ctan7 202212 202302 Australia.png 2,000 × 1,600; 314 KB
-
Clrmax 20230709-20230715 USA maximum temperatures.png 4,400 × 3,400; 1.56 MB
-
Clrtanom 20230514-20230520 USA.png 6,600 × 5,100; 2.22 MB
-
NWS-NOAA Europe Extreme maximum temperature 2015 Sum.png 2,439 × 2,490; 405 KB
-
NWS-NOAA Europe Extreme maximum temperature AUG 02- 08, 2015.png 2,431 × 2,479; 233 KB
-
NWS-NOAA Europe Extreme maximum temperature AUG 09 - 15, 2015.png 2,437 × 2,488; 320 KB
-
NWS-NOAA Europe Extreme maximum temperature AUG 16 - 22, 2015.png 2,437 × 2,489; 315 KB
-
NWS-NOAA Europe Extreme maximum temperature AUG 23 - 29, 2015.png 2,437 × 2,488; 310 KB
-
NWS-NOAA Europe Extreme maximum temperature AUG 30 - SEP 05, 2015.png 2,438 × 2,489; 320 KB
-
NWS-NOAA Europe Extreme maximum temperature JUL 12 - 18, 2015.png 2,436 × 2,484; 310 KB
-
NWS-NOAA Europe Extreme maximum temperature JUL 19 - 25, 2015.png 2,427 × 2,487; 313 KB
-
NWS-NOAA Europe Extreme maximum temperature JUL 26 - AUG 01, 2015.png 2,436 × 2,488; 315 KB
-
NWS-NOAA Europe Extreme maximum temperature JUL 5 - 11, 2015.png 2,422 × 2,483; 292 KB
-
NWS-NOAA Europe Extreme maximum temperature JUN 28 - JUL 04, 2015.png 2,444 × 2,492; 315 KB
-
NWS-NOAA Europe Extreme maximum temperature SEP 06 - 12, 2015.png 2,439 × 2,490; 306 KB
-
NWS-NOAA Europe Extreme maximum temperature SEP 13 - 19, 2015.png 2,439 × 2,491; 313 KB
-
NWS-NOAA Europe Extreme maximum temperature SEP 20 - 26, 2015.png 2,439 × 2,490; 301 KB
-
NWS-NOAA Europe Extreme minimum temperature FEB 5 - FEB 11, 2012.gif 590 × 580; 71 KB
-
NWS-NOAA Europe Extreme minimum temperature JAN 1 - 14, 2017 (cropped).png 2,400 × 2,500; 348 KB
-
NWS-NOAA Europe Extreme minimum temperature JAN 1 - 21, 2017 (cropped).png 2,400 × 2,500; 350 KB
-
NWS-NOAA Europe Extreme minimum temperature JAN 1 - 28, 2017 (cropped).png 2,400 × 2,500; 352 KB
-
NWS-NOAA Europe Extreme minimum temperature JAN 1 - 7, 2017.png 2,700 × 2,700; 341 KB
-
NWS-NOAA Europe Extreme minimum temperature JAN 1 - FEB 4, 2017 (cropped).png 2,400 × 2,500; 352 KB
-
NWS-NOAA Europe Extreme minimum temperature JAN 15 - 21, 2017.png 2,700 × 2,700; 335 KB
-
NWS-NOAA Europe Extreme minimum temperature JAN 22 - 28, 2017.png 2,700 × 2,700; 332 KB
-
NWS-NOAA Europe Extreme minimum temperature JAN 29 - FEB 4, 2017.png 2,700 × 2,700; 331 KB
-
NWS-NOAA Europe Extreme minimum temperature JAN 8 - 14, 2017.png 2,700 × 2,700; 341 KB
-
NWS-NOAA Europe Maximum Temperature (C) NOV 2-8, 2014.png 2,434 × 2,488; 276 KB
-
NWS-NOAA Europe Maximum Temperature (C) NOV 9-15, 2014.png 2,428 × 2,488; 272 KB
-
NWS-NOAA Europe Percentage of Normal Precipitation DEC 30, 2018 - JAN 5, 2019.png 2,700 × 2,700; 230 KB
-
NWS-NOAA Europe Percentage of Normal Precipitation JAN 13 - 19, 2019.png 2,700 × 2,700; 313 KB
-
NWS-NOAA Europe Percentage of Normal Precipitation JAN 6 - 12, 2019.png 2,700 × 2,700; 304 KB
-
NWS-NOAA Europe Percentage of Normal Precipitation NOV 2014 cropped.png 1,812 × 1,243; 171 KB
-
NWS-NOAA Europe Percentage of Normal Precipitation NOV 2014.png 2,434 × 2,488; 325 KB
-
NWS-NOAA Europe Total Percipitation MAY 11-17, 2014.png 2,400 × 2,250; 217 KB
-
NWS-NOAA Europe Total Percipitation NOV 2-8, 2014.png 2,425 × 2,485; 286 KB
-
NWS-NOAA Europe Total Percipitation NOV 2014.png 2,428 × 2,488; 289 KB
-
NWS-NOAA Europe Total Percipitation NOV 30-DEZ 6, 2014.png 2,431 × 2,485; 280 KB
-
NWS-NOAA Europe Total Percipitation NOV 9-15, 2014.png 2,425 × 2,488; 288 KB
-
NWS-NOAA Europe Total precipitation JAN 1 - 7, 2017.png 2,700 × 2,700; 286 KB
-
NWS-NOAA Europe Total precipitation JAN 15 - 21, 2017.png 2,700 × 2,700; 303 KB
-
NWS-NOAA Europe Total precipitation JAN 22 - 28, 2017.png 2,700 × 2,700; 280 KB
-
NWS-NOAA Europe Total precipitation JAN 29 - FEB 4, 2017.png 2,700 × 2,700; 304 KB
-
NWS-NOAA Europe Total precipitation JAN 8 - 14, 2017.png 2,700 × 2,700; 305 KB
-
Pcpns 20220731 20220806 Europe.png 2,700 × 2,700; 980 KB
-
Pcpns anomaly in July 2002 in Europe.png 2,700 × 2,700; 1.17 MB
-
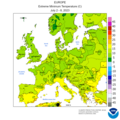
Wcmax1 20230702-20230708 Europe.png 1,800 × 1,800; 559 KB
-
Wcmax1 20230709-20230715 Europe maximum temperatures.png 1,800 × 1,800; 573 KB
-
Wcmax1 20230813-20230819 Europe maximum temperatures.png 1,800 × 1,800; 545 KB
-
Wcmax1 20230924-20230930 Europe maximum temperatures.png 1,800 × 1,800; 541 KB
-
Wcmax15 20230723-20230729 Northern South America maximum temperatures.png 2,000 × 2,000; 549 KB
-
Wcmax15 20230730-20230805 Northern South America maximum temperatures.png 2,000 × 2,000; 552 KB
-
Wcmax2 20230709-20230715 East Asia maximum temperatures.png 2,000 × 1,700; 545 KB
-
Wcmax2 20230716-20230722 East Asia maximum temperatures.png 2,000 × 1,700; 551 KB
-
Wcmax2 20230730-20230805 East Asia maximum temperatures.png 2,000 × 1,700; 556 KB
-
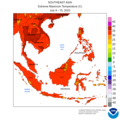
Wcmax5 20230709-20230715 Southeast Asia maximum temperatures.png 1,800 × 1,800; 397 KB
-
Wcmax6 20230709-20230715 South Asia maximum temperatures.png 1,600 × 1,800; 420 KB
-
Wcmax7 20230709-20230715 Australia maximum temperatures.png 2,000 × 1,600; 288 KB
-
Wcmax8 20230723-20230729 Southern South America maximum temperatures.png 1,700 × 2,000; 410 KB
-
Wcmax8 20230730-20230805 Southern South America maximum temperatures.png 1,700 × 2,000; 407 KB
-
Wcmax9 20230709-20230715 Mexico maximum temperatures.png 1,700 × 1,360; 364 KB
-
Wcmax9 20230716-20230722 Mexico maximum air temperatures.png 1,700 × 1,360; 360 KB
-
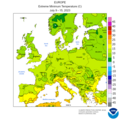
Wcmin1 20230702-20230708 Europe.png 1,800 × 1,800; 557 KB
-
Wcmin1 20230813-20230819 Europe minimum temperatures.png 1,800 × 1,800; 573 KB
-
Wcmin1.png 1,800 × 1,800; 554 KB
-
Wcmin2 20230709-20230715 East Asia minimum temperatures.png 2,000 × 1,700; 544 KB
-
Wcmin2 20230716-20230722 East Asia mimimum temperatures.png 2,000 × 1,700; 533 KB
-
Wcmin7.png 2,000 × 1,600; 299 KB
-
Wcmin9 20230709-20230715 Mexico minimum temperatures.png 1,700 × 1,360; 361 KB
-
Wcpcp1 20220710 20220716 Europe.png 1,800 × 1,800; 541 KB
-
Wcpcp1 20230416-20230422 Europe.png 1,800 × 1,800; 540 KB
-
Wcpcp1 20230507-20230513 Europe.png 1,800 × 1,800; 570 KB
-
Wcpcp1 20230514-20230520 Europe.png 2,700 × 2,700; 998 KB
-
Wcpcp1 20230702-20230708 Europe.png 2,700 × 2,700; 1,018 KB
-
Wcpcp1 20230709-20230715 Europe total precipitation.png 1,800 × 1,800; 585 KB
-
Wcpcp1 20230716-20230722 Europe total precipitation.png 1,800 × 1,800; 581 KB
-
Wcpcp1 20230723-20230729 Europe total precipitation.png 1,800 × 1,800; 593 KB
-
Wcpcp1 20230813-20230819 Europe total precipitation.png 1,800 × 1,800; 595 KB
-
Wcpcp1 20230924-20230930 Europe total precipitation.png 2,700 × 2,700; 928 KB
-
Wcpcp2 20230709-20230715 East Asia total precipitation.png 2,000 × 1,700; 710 KB
-
Wcpcp2 20230716-20230722 East Asia total precipitation.png 2,000 × 1,700; 693 KB
-
Wcpcp5 20230709-20230715 Southeast Asia total precipitation.png 1,800 × 1,800; 517 KB
-
Wcpcp6 20230709-20230715 South Asia total precipitation.png 1,600 × 1,800; 586 KB
-
Wcpcp7.png 3,000 × 2,400; 488 KB
-
Wcpcp9 20230709-20230715 Mexico total precipitation.png 2,550 × 2,040; 664 KB
-
Wctan1 20230416-20230422 Europe.png 1,800 × 1,800; 570 KB
-
Wctan1 20230423 20230429 Europe.png 1,800 × 1,800; 577 KB
-
Wctan1 20230514-20230520 Europe.png 1,800 × 1,800; 567 KB
-
Wctan1 20230702-20230708 Europe.png 1,800 × 1,800; 565 KB
-
Wctan1 20230709-20230715 Europe temperature anomalies.png 1,800 × 1,800; 569 KB
-
Wctan1 20230723-20230729 Europe temperature anomalies.png 1,800 × 1,800; 552 KB
-
Wctan1 20230730-20230805 Europe temperature anomalies.png 1,800 × 1,800; 573 KB
-
Wctan1 20230813-20230819 Europe temperature anomalies.png 1,800 × 1,800; 559 KB
-
Wctan1 20230924-20230930 Europe temperature anomalies.png 1,800 × 1,800; 581 KB
-
Wctan1 20231001-20231007 Europe temperature anomalies.png 1,800 × 1,800; 574 KB
-
Wctan1 20231015-20231021 Europe temperature anomalies.png 1,800 × 1,800; 536 KB
-
Wctan1 20231022-20231028 Europe temperature anomalies.png 1,800 × 1,800; 563 KB
-
Wctan1 20231029-20231104 Europe temperature anomalies.png 1,800 × 1,800; 581 KB
-
Wctan15 20230723-20230729 Northern South America temperature anomalies.png 2,000 × 2,000; 566 KB
-
Wctan15 20230730-20230805 Northern South America temperature anomalies.png 2,000 × 2,000; 563 KB
-
Wctan2 20230409 20230415 temperature anomaly South Asia.png 1,600 × 1,800; 392 KB
-
Wctan2 20230409 20230415 temperature anomaly Southeast Asia.png 1,800 × 1,800; 385 KB
-
Wctan2 20230409 20230415 temperature anomaly.png 2,000 × 1,700; 496 KB
-
Wctan2 20230416-20230422 East Asia.png 2,000 × 1,700; 497 KB
-
Wctan2 20230423 20230429 East Asia.png 2,000 × 1,700; 509 KB
-
Wctan2 20230702-20230708 East Asia temperature anomalies.png 2,000 × 1,700; 500 KB
-
Wctan2 2023070920230715 East Asia temperature anomalies.png 2,000 × 1,700; 513 KB
-
Wctan2 20230716-20230722 East Asia etmperature anomalies.png 2,000 × 1,700; 507 KB
-
Wctan2 20230730-20230805 East Asia temperature anomalies.png 2,000 × 1,700; 491 KB
-
Wctan5 20230423 20230429 Southeast Asia.png 1,800 × 1,800; 377 KB
-
Wctan5 20230709-20230715 Southeast Asia temperature anomalies.png 1,800 × 1,800; 363 KB
-
Wctan6 20230416-20230422 South Asia.png 1,600 × 1,800; 391 KB
-
Wctan6 20230423 20230429 SouthAsia.png 1,600 × 1,800; 380 KB
-
Wctan6 20230709-20230715 South Asia temperature anomalies.png 1,600 × 1,800; 399 KB
-
Wctan7 2023040920230415 Asutralia.png 2,000 × 1,600; 341 KB
-
Wctan7 20230423-20230429 Australia.png 2,000 × 1,600; 336 KB
-
Wctan7 20230702-20230708 Australia temperature anomalies.png 2,000 × 1,600; 330 KB
-
Wctan7 20230709-20230715 Australia temperature anomalies.png 2,000 × 1,600; 331 KB
-
Wctan7 20230730-20230805 Australia temperature anomalies.png 2,000 × 1,600; 331 KB
-
Wctan8 20230723-20230729 Southern South America temperature anomalies.png 1,700 × 2,000; 401 KB
-
Wctan8 20230730-20230805 Southern South America temperature anomalies.png 1,700 × 2,000; 381 KB








.png/115px-NWS-NOAA_Europe_Extreme_minimum_temperature_JAN_1_-_14%2C_2017_(cropped).png)
.png/115px-NWS-NOAA_Europe_Extreme_minimum_temperature_JAN_1_-_21%2C_2017_(cropped).png)
.png/115px-NWS-NOAA_Europe_Extreme_minimum_temperature_JAN_1_-_28%2C_2017_(cropped).png)

.png/115px-NWS-NOAA_Europe_Extreme_minimum_temperature_JAN_1_-_FEB_4%2C_2017_(cropped).png)


_NOV_2-8%2C_2014.png/117px-NWS-NOAA_Europe_Maximum_Temperature_(C)_NOV_2-8%2C_2014.png)
_NOV_9-15%2C_2014.png/117px-NWS-NOAA_Europe_Maximum_Temperature_(C)_NOV_9-15%2C_2014.png)


